The Daily Reckoning
Why Do So Many Numbers Begin With 1?
Benford’s law turns the unequal widths of logarithmic intervals into a surprising prediction about first digits—and a useful warning about suspicious data.
- Difficulty
- Intermediate
- Area
- Probability and statistics
- Reading time
- 9 minutes
- Prerequisites
- Percentages · Base-ten logarithms as exponents
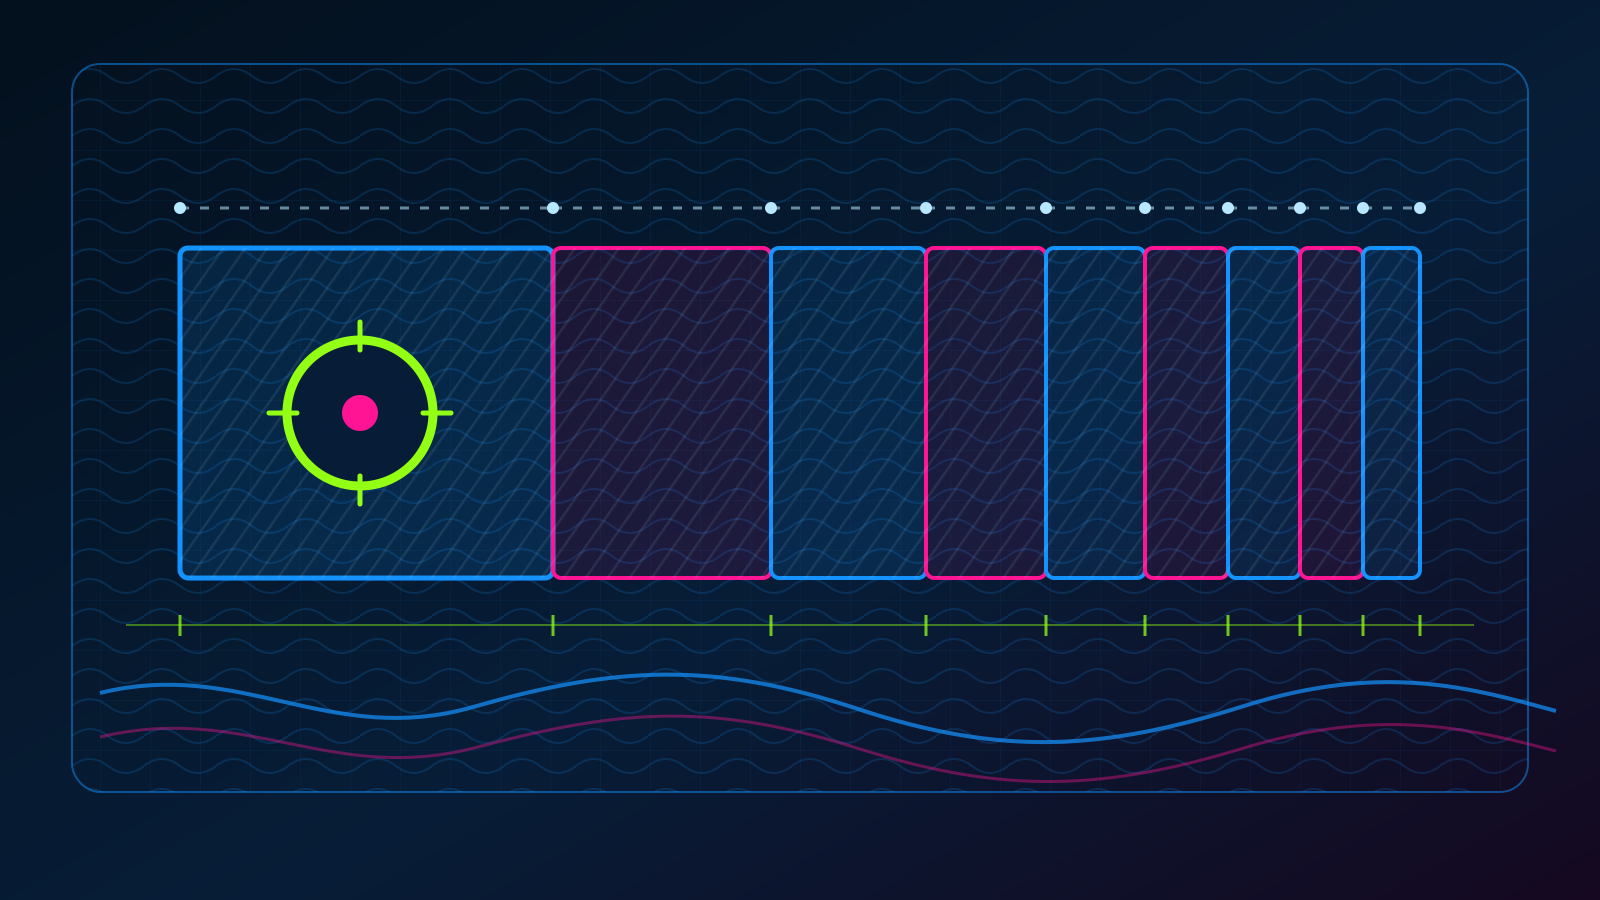
Open a large ledger of expenses and ignore every digit except the first nonzero one. The amount contributes a 1. The amount contributes a 7. If no minimum, maximum, or pricing rule favors particular digits, should 1 through 9 each appear about one-ninth of the time?
Many datasets answer no. In data that follow Benford’s law, about 30.1 percent of values begin with 1, while only about 4.6 percent begin with 9. A first digit of 1 is roughly 6.6 times as common as a first digit of 9.
The phrase “in data that follow Benford’s law” matters: the law describes certain datasets, not numbers in general. Human heights, telephone numbers, and prices fixed at $9.99 have their own constraints. The lesson is to recognize the logarithmic pattern and to know when the pattern has no right to appear.
First digits live on a logarithmic ruler
Every positive number can be written in scientific notation as
where is a number satisfying , and is an integer. The number is the significand. For example,
so the significand is and the first digit is 7. Multiplying by a power of 10 moves the decimal point but leaves the first digit unchanged.
Let denote the first nonzero digit of a positive value. The event occurs when the significand lies from up to, but not including, . On an ordinary number line, every interval
has width 1. A base-ten logarithm changes those widths. The interval for digit becomes
The diagram below places all nine first-digit intervals inside one logarithmic decade. Each percentage is the width of its interval.
One decade on a logarithmic ruler
Smaller first digits occupy wider intervals
If values are spread uniformly across the logarithmic ruler, interval width becomes probability. Benford’s first-digit formula is therefore
where is one of the integers , and means “the probability that the first digit equals .” The National Institute of Standards and Technology gives the same definition.
For ,
For ,
The imbalance comes from geometry after a change of scale. No digit is lucky. The logarithmic interval assigned to 1 is wider.
Worked example: how many values begin with 1, 2, or 3?
Suppose a suitable dataset contains 1,000 positive measurements. We want the expected number whose first digit is 1, 2, or 3.
The three events occupy adjacent intervals, so add their probabilities:
The fractions telescope: the two 2s cancel, as do the two 3s. Multiply the probability by the number of measurements:
We should expect about 602 of the 1,000 measurements to begin with 1, 2, or 3. An expected count is a long-run center, not a promise that one sample will contain exactly 602.
A sequence that keeps crossing powers of ten
The powers of two——repeatedly grow through the intervals , , , and beyond. Their first digits look irregular, but their logarithms advance by the fixed step and wrap around after each whole unit.
The interactive chart below computes first digits from logarithms, so it can examine hundreds of powers without overflowing the browser’s ordinary number range. Increase the sample size, then multiply every term by a fixed factor. The striped bars show the observed frequencies; the dashed markers show Benford’s formula.
Interactive first-digit laboratory
Watch powers of two approach the logarithmic pattern
| First digit | 1 | 2 | 3 | 4 | 5 | 6 | 7 | 8 | 9 |
|---|---|---|---|---|---|---|---|---|---|
| Observed | 30.0% | 17.0% | 13.0% | 10.0% | 7.0% | 7.0% | 6.0% | 5.0% | 5.0% |
| Benford | 30.1% | 17.6% | 12.5% | 9.7% | 7.9% | 6.7% | 5.8% | 5.1% | 4.6% |
Multiplying every value by 3.28 or 7.3 changes many individual first digits. For a long sequence, multiplication acts like rotating points around the logarithmic decade. The overall pattern remains close because the points are already spread around that cycle.
When should the law appear?
A dataset follows Benford exactly when the fractional parts of its base-ten logarithms are uniformly distributed between 0 and 1. That sentence is a criterion, not an explanation for why a particular ledger, river table, or scientific database should satisfy it.
One useful clue is scale invariance. Converting a collection of lengths from metres to feet multiplies every value by the same constant. If the collection spans molecules, people, buildings, and astronomical distances, changing units should not create a fundamentally different aggregate pattern of first digits. On the logarithmic ruler, unit conversion shifts every point by the same amount. A uniform spread is the only probability distribution on the cycle that remains unchanged under every possible shift.
Theodore Hill’s 1995 paper, “A Statistical Derivation of the Significant-Digit Law”, gives a different route. Under Hill’s model for randomly selecting probability distributions and then sampling from them, the combined significant digits approach Benford’s law as the number of distributions grows. Neither argument says that “large” or “natural” data must comply.
Before applying the formula, ask how the values were made:
- Measurements produced by several processes and spread across multiple powers of ten are plausible candidates.
- Values with an imposed minimum or maximum may be poor candidates. Adult heights measured in centimetres cluster in a narrow interval.
- Assigned numbers—telephone numbers, identification codes, invoice IDs—do not measure quantities at all.
- Human-set prices, standard fees, and repeated transaction amounts can create deliberate spikes.
Failure to match Benford can mean fraud, an error, a threshold, a business practice, the wrong statistical model, or ordinary sample noise. A digit test cannot decide among those causes by itself.
Try it yourself
Problem 1
In a Benford-distributed dataset, what percentage of values begin with 7?
Reveal the solution
Substitute into the formula:
Multiplying by 100 converts the probability to about percent.
Problem 2
A collection of 2,500 measurements is known to follow Benford’s law. About how many measurements should begin with 1 or 2?
Reveal the solution
The intervals for first digits 1 and 2 join to form on the significand scale. Their combined probability is
Therefore,
The expected count is about measurements.
A worn book, a forgotten paper, and a second name
Simon Newcomb, a Canadian-American astronomer and mathematician, published the first known account in 1881. His two-page note begins from a material observation: the early pages of books containing logarithm tables wore out faster than the later pages. Before electronic calculators, people repeatedly opened those books to turn multiplication and division into addition and subtraction. The wear suggested that calculations involved numbers beginning with small digits more often than numbers beginning with large ones.
Newcomb derived the logarithmic probabilities and published them in the American Journal of Mathematics. His paper attracted little continuing attention. Frank Benford, a physicist at General Electric, seems to have rediscovered the pattern independently. In 1938 he published “The Law of Anomalous Numbers”, comparing 20,229 observations drawn from river areas, city populations, physical constants, newspaper statistics, and other sources.
The law now carries Benford’s name, although Newcomb printed the formula fifty-seven years earlier. That history is less a lone-genius discovery than a change in evidence. Newcomb read a pattern from the physical wear left by anonymous users of a shared computational tool. Benford assembled enough heterogeneous data to make the pattern difficult to dismiss.
Useful alarm, dangerous verdict
Auditors use digit frequencies to decide where closer examination may be worthwhile. Mark Nigrini’s Journal of Accountancy guide shows how spikes can expose fictitious entries, duplicated amounts, or ordinary business practices. The same guide repeatedly warns that deviations are indicators. Transaction records and supporting evidence must establish what happened.
Benford screening also reaches beyond money. In 2024, researchers at the National Institute of Standards and Technology reported close Benford agreement in atomic-spectra and opacity databases and proposed the law as a way to flag database inconsistencies.
Politics supplies the sharper warning. After the 2020 United States presidential election, social-media posts treated first-digit deviations in local vote totals as mathematical proof of fraud. Precinct vote counts often occupy a narrow range determined by precinct size and vote share, so they need not follow Benford’s first-digit law. A 2011 study in Political Analysis found Benford-based election diagnostics problematic and potentially misleading, while Reuters documented the specific misuse in 2020.
A formula can be computed correctly and applied to the wrong population. In forensic work, model choice is part of the evidence.
One idea to remember
Benford’s law is the geometry of equal spacing on a logarithmic ruler: digit receives probability . A mismatch can nominate records for investigation only after the data-generating process gives the formula a reason to apply.
Useful next directions are scale invariance, which explains why unit changes lead to logarithms, and forensic statistics, which studies how anomaly screens can separate genuine evidence from false alarms.
Sources
- Simon Newcomb, “Note on the Frequency of Use of the Different Digits in Natural Numbers”, American Journal of Mathematics, 1881.
- Frank Benford, “The Law of Anomalous Numbers”, Proceedings of the American Philosophical Society, 1938.
- Paul E. Black, “Benford’s law”, National Institute of Standards and Technology Dictionary of Algorithms and Data Structures.
- Theodore P. Hill, “A Statistical Derivation of the Significant-Digit Law”, Statistical Science, 1995.
- Mark J. Nigrini, “Using Benford’s Law to Reveal Journal Entry Irregularities”, Journal of Accountancy, 2022.
- Yuri Ralchenko and Jean-Christophe Pain, “Benford’s Law in Atomic Spectra and Opacity Databases”, National Institute of Standards and Technology, 2024.
- Joseph Deckert, Mikhail Myagkov, and Peter C. Ordeshook, “Benford’s Law and the Detection of Election Fraud”, Political Analysis, 2011.
- Reuters, “Deviation from Benford’s Law Does Not Prove Election Fraud”, November 10, 2020.